Collaborators: Kelly, Autumn, Audrey
Last Updated: 12/1/2025
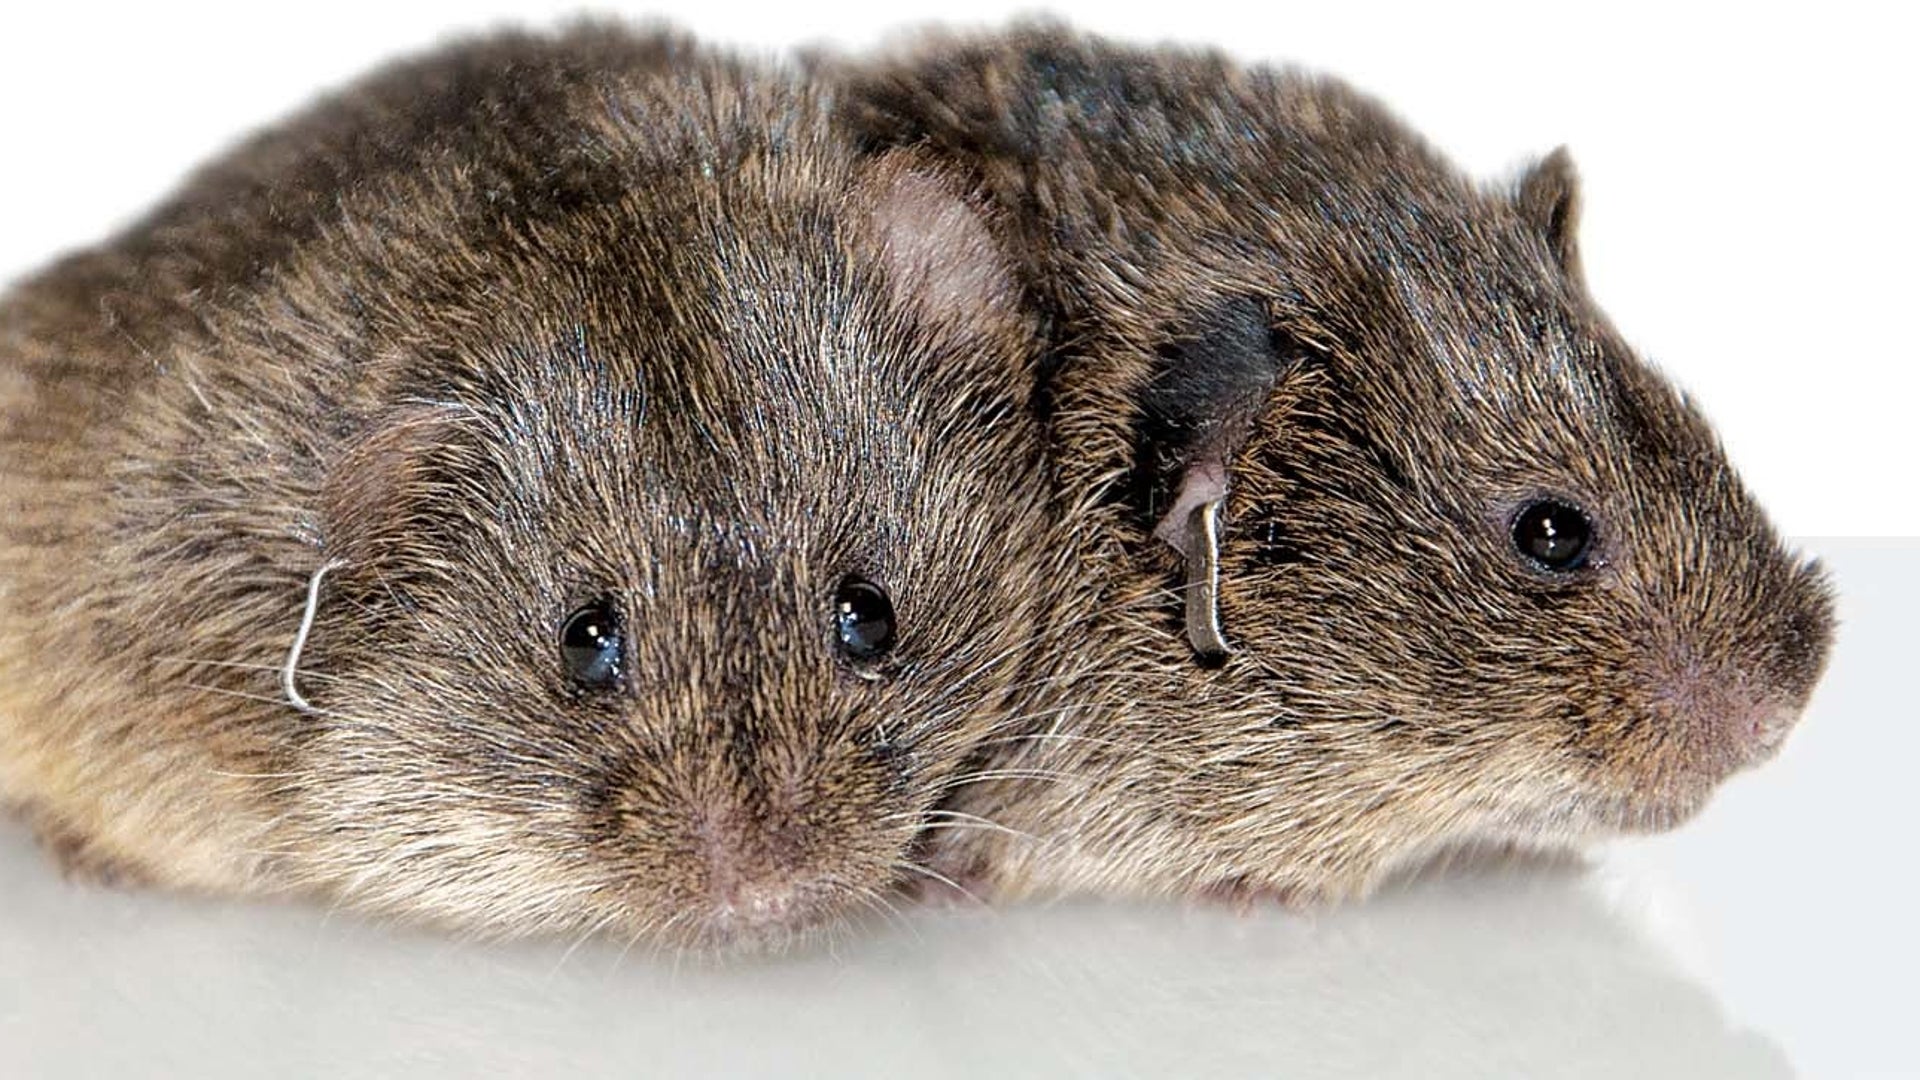
Memory formation is salient topic in modern medical research. Whether caused by neurodegenerative or neuropsychiatric disease, there are several medical conditions that can impact a patient's long-term memory formation. By studying patterns in memory formation in prairie voles, a unique rodent species that forms complex social relationships, we may be able to uncover the neural mechanisms for generating long-lasting social memories.
One of these signals is known as a sharp wave ripple (SWR), which is a brief oscillatory event produced by synchronous neuron activity and vital to memory consolidation. The neuronal activity within a SWR for spatial memories is a sequential replay of neuronal firing that recapitulates the exact event being converted to a memory. In this project, we investigate neuron activity during SWRs following social interactions. Specifically, we are interested in identifying whether SWRs for social memories similarly maintain sequential patterns, or whether a specific set of neurons are sufficient to encode a social memory without maintaining a set firing order.
Important Notes and Scientific Considerations: When processing SWR data, a single neuron is identified by its 'cluster id' and a single unit of activity is called a 'spike'. Neurons come in a variety of types that play different roles in the biological system. Specifically, pyramidal neurons are known to maintain sequences in replay events. Future work will include 'cluster id type' data to filter for pyramidal neurons.
If you would like to re-create our analysis, you can clone our respository by running...
git clone https://github.com/KellyWinther/Project_swe4s.git
Then, to download the data run ...
scripts/download_data.sh
Note: google has a download limit per IP address so you will only be able to do this once. It you run into errors, just visit the google website and download directly to your device: https://drive.google.com/drive/folders/1MCQce7FXHNKEQg97zs5YrXFSZbxB_iDU?usp=drive_link
Once the datasets are downloaded to run our snakemake workflow, simply run...
cd Project_swe4s
snakemake --cores 1
This will create an 'outputs/' folder in the root directory with some intermediate data products. This snakemake will producecorr correlation matrix and raster plots of neuron spikig activity for each full_data set provided in the download. If you are having trouble getting the workflow to run, try using the environment.yml file we provided!
There are three important folders in our repository...
- /src ~ Stores the Python scripts used in our reducation and analysis
- /data ~ Holds the data used for internal testing / example scripts and our full analysis
- /test ~ Contains all the unit / functional test scripts
Specific descriptions of each file in these directories are provided below. However, there are also a couple that we kept in the repository's root directory. These include...
environment.yml~ Has the dependency information for our projectSnakefile~ The snakemake workflow used for our final reduction
Any files that do not fit cleanly into the aforementioned folders will be added to the root directory.
The core functionality of our workflow is separated into three files...
-
analysis_utils.py~ Responsible for:- building a 'correlation matrix' showing how often a given cluster fires given another cluster has also fired.
- building histograms from circularly permuted shifts of SWR start times to assess whether a neuron cluster spikes within a ripple time more often than expected.
-
loading_utils.py~ Contains three functions that are necessary for processing our data. Specifically, these functions are responsible for loading spike cluster data into a Pandas DataFrame and joining two DataFrames based on whether an 'event time' falls within a 'time window.' -
raster_plot_utils.py~ Uses the data produced by 'loading_utils.py' to generate "Raster plots." Raster plots are useful for visualizing discrete spiking data. These are scatter plots used in neuroscience to visualize the timing of action potentials (spikes) from one or more neurons over time. Each row in the plot represents a single neuron, and each vertical line represents a spike at a specific time point. This visualization allows researchers to see patterns in neural activity and how it relates to specific stimuli or task. Our plots are spiking activity, where time on the x-axis is relative to the peak frequency of the sharp wave ripple. Around it's peak, the SWR often has the greatest number of co-active neurons. The arguments in the functions allow you to decide if you would like to plot all data for all sharp wave ripples or if you want to plot a single or subset (provide a list of SWR index) of spiking data in the raster plot. You can choose colors, time windows relative to the peak of the SWRs, and more. See the example_make_raster arguments for more details. -
sequence_matching_utils.py~ These functions combine to provide the investigation of sequenctial cluster spikes. Using hash tables, they search for the longest match between spikes in SWRs and spikes during awake social behaviors. Plots of normalized overlap help visualize the replay between awake and asleep spiking activity.
There are also example scripts that use the main function and demonstrate example usage of the utils scripts. Example calls are provided at the top of each docstring for the example files.
- example_make_correlation_matrix.py
- example_make_raster.py
- example_run_permutation.py
- example_sequence_matching.py
After running the download_data.sh script in "scripts/", you will have two sub-folders labelled 'test_data' and 'full_data'. test_data holds short, sample versions of our data that we can use for quick testing, but make no biological sense. full_data includes subfolders for two prairie voles, each with two types of social interaction recordings. One Partner introduction with a novel opposite-sex vole and one Same-sex (SS) introduction. The snakemake will use all these files to make basic raster plots and correlation plots of co-activity. They are also randomly selected in the different "example usage" portion of each example_..._.py file. Below are more details on each of the types of files in the folders.
There are five primary types of data contained here...
-
spike_times.npy- a 1D numpy array
- list of times an spike was found in the recording area
-
spike_clusters.npy- a 1D numpy array
- matches the length of spike_times, but now instead of times in the rows it has the cluster ID number. Biologically speaking, a cluster ID represents a single neuron.
-
clusterKSLabel.tsv- a 2D array with the cluster ID number and a judgement on how good of a recording we attained from that cluster. options are "good" or "mau"
- "good" the cluster ID is likely one single neuron's activity
- "mau" the cluster ID is likely a mixture of neuron activity and not a clean representation of any single neuron.
-
Animal#_SocialType_events_with_indices.csvexample: "7744_SSintro_events_with_indices.csv"- Social Type represents what social interaction the animal expeienced in that recording. Options are "PartnerIntro" or "SSIntro". - Partner Intro is the introduction to an novel opposite sex animal - SS Intro is the introduction to a novel same-sex animal.
- This is a CSV that defines behavior events across the recording. Examples: sleeping, social interaction, etc. Including there start and stop times and other details like duration. This CSV is autogenerated output by BORIS animal behvaior labeling software.
- the time indicies in the columns "indexStart" and "indexEnd" match the spike times after you adjust for the camera sampling rate of 2500. Meaning the index must be divided by 2500 to get to seconds and align to spike times.
-
Animal#_SocialType_SWRs_BrainRegion.csvexample: "7744_SSintro_SWRs_ca2.csv"- sharp wave ripple csv with start and stop times of each detected ripple.
- also includes some ripple features: - ripple peak time - duration - max envelope amplitude of the signal (using the hilbert transformation)
- brain region label "ca2" is hippocampal subregion CA2
Here you can find the scripts we use for automated testing. These are broken up into "functional tests" and "unit tests." We intend to increase the scope of these tests in the near future.
-
test_load_and_analy_utils.py~ Has unit tests for functions inanalysis_utils.pyandloading_utils.py.- Responsible for testing:
- Correct datatype and output structures
- Missing data errors
- Bad file path errors
- Edge cases such as empty lists, missing columns and invalid modes
- Circular permutation functional flow tests To manually run tests, execute the following line from the root directory ...
python -m unittest test/test_load_and_analy_utils.py - Responsible for testing:
-
test_raster_utils.py~ Has unit tests for functions in theraster_plot_utils.py.- Responsible for testing:
- Correct long-form exploding
- Correct
t_relcalculation - Handling of string list inputs
- Ripple filtering
- Incorrect datatype handling
- Invalid ripple index handling
- DOES NOT test visual output To manually run tests, execute the following line from the root directory...
python -m unittest test/test_raster_utils.py - Responsible for testing:
-
run_analysis.sh~ Has functional testing for the loading and analysis pipleine. It uses theexample_call.pyfile to run through analysis pipeline and outputs a filecorrelation_matrix.csvwhich is compared toexpected_correlation_matrix.csvfound in /data/testdata. This expected correlation matrix fits the output from the following command...
python src/example_call.py \
    --spike_time_filename "data/full_data/7742/PartnerIntro/spike_times.npy" \
    --cluster_filename "data/full_data/7742/PartnerIntro/spike_clusters.npy" \
    --KSlabel_filename "data/full_data/7742/PartnerIntro/cluster_KSLabel.tsv" \
    --swr_filename "data/full_data/7742/PartnerIntro/7742_Partnerintro_sleepyvole_SWRs_ca2.csv" \
    --output_csv True
The test passes if the output from running the example call pipeline matches the expected_correlation_matrix.csv. To run the analysis functional test execute the following line from the root directory...
bash test/run_analysis.sh
run_analysis.py~ Has functional testing for the raster plotting pipleine. It uses theexample_make_raster.pyfile to run through raster plotting pipeline and outputs a fileexploded_raster_data.csvwhich is compared toexpected_raster_data.csvfound in /data/testdata. The expected raster data fits the output from the following command...
python src/example_make_raster.py \
    --spike_time data/test_data/TEST_spike_times.npy \
    --clusters data/test_data/TEST_spike_clusters.npy \
    --kslabels data/test_data/TEST_cluster_KSLabel.tsv \
    --swr_csv data/test_data/TEST_SWRs_ca2.csv \
    --window 3 \
    --color black \
    --tick_width 100 \
    --height 5 \
    --width 7 \
    --ripple_index 0 1 \
    --output_csv True
The test passes if the output from running the example raster plot pipeline matches the expected_raster_data.csv. To run the raster plot functional test execute the following line from the root directory...
bash test/run_raster.sh